Waze Data Could Help Predict Collisions and Reduce Response Time
Waze users notify the app of crashes an average of 2 minutes, 41 seconds before anyone alerts law enforcement. https://t.co/yaRuNV3Xeu
— WIREDTransport (@WIREDTransport) July 8, 2019
If you’re familiar with navigation apps, you’re probably already acquainted with Waze. Many drivers use it to find the shortest route to their destination and/or to find detours to avoid traffic jams. It turns out that Waze has two more uses: helping predict car crashes and curbing emergency-service response time.
Modern Defenses: Learn more about the Silverado 1500’s safety tech

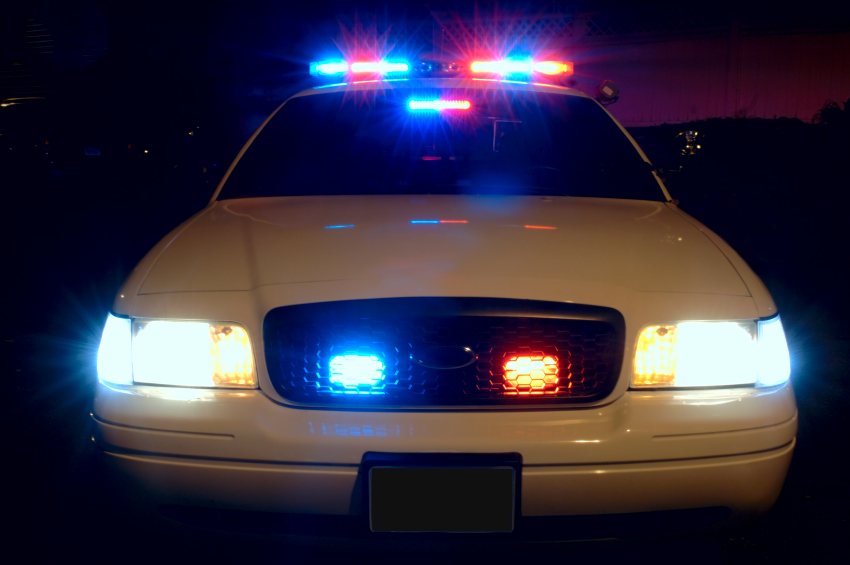
Photo: Scott Davidson, Flickr
Current method for predicting accidents
Per Wired, the Department of Transportation currently uses computer-based models to predict accidents. However, this technology classifies accidents as “rare events” because they occur infrequently. As such, models can fail to predict certain collisions, as associate professor of computer science at Concordia University Tristan Glatard confirms.
Using Waze data
Back in May, Jama Surgery included a study from researchers with UCLA and University of California, Irvine. The paper suggested that certain California locations could use data from Waze to reduce the response time of emergency services.
Per Wired, the researchers compared the Waze data with crash data gleaned from the California Highway Patrol. They found that Waze users reported crashes via Waze an average of 2 minutes and 41 seconds before anyone reported those crashes to law enforcement.
Sean Young, executive director of the University of California Institute for Prediction Technology, articulated the potential that this data has for helping first responders get to the crash scenes faster. “If these methods can cut the response time down by between 20 to 60 percent, then it’s going to have [a] positive clinical impact.”

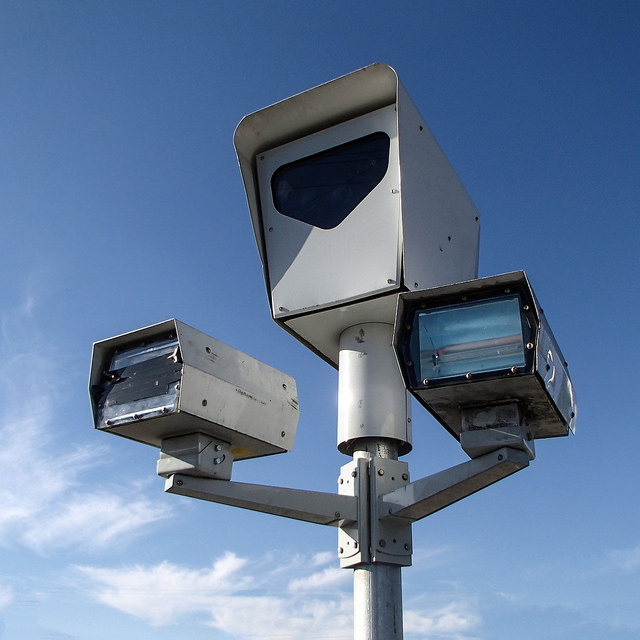
Photo: Robert Couse-Baker
Small steps to safer roads and faster response times
Interestingly enough, some U.S. cities are experimenting with incorporating Waze data into their respective state’s crash-prediction models. For example, the DOT in Bellevue, Washington has built an interactive dashboard to identify crash patterns and risks on local roads. The map has a heatmap function to indicate portions of the roadway where accidents tend to occur most frequently. Transportation planners can then review data collected from local traffic cameras to help pinpoint the cause of the accident frequency in these key areas.
Buyer’s Dilemma: Discover whether leasing or purchasing is best for you
News Source: Wired

The News Wheel is a digital auto magazine providing readers with a fresh perspective on the latest car news. We’re located in the heart of America (Dayton, Ohio) and our goal is to deliver an entertaining and informative perspective on what’s trending in the automotive world. See more articles from The News Wheel.

