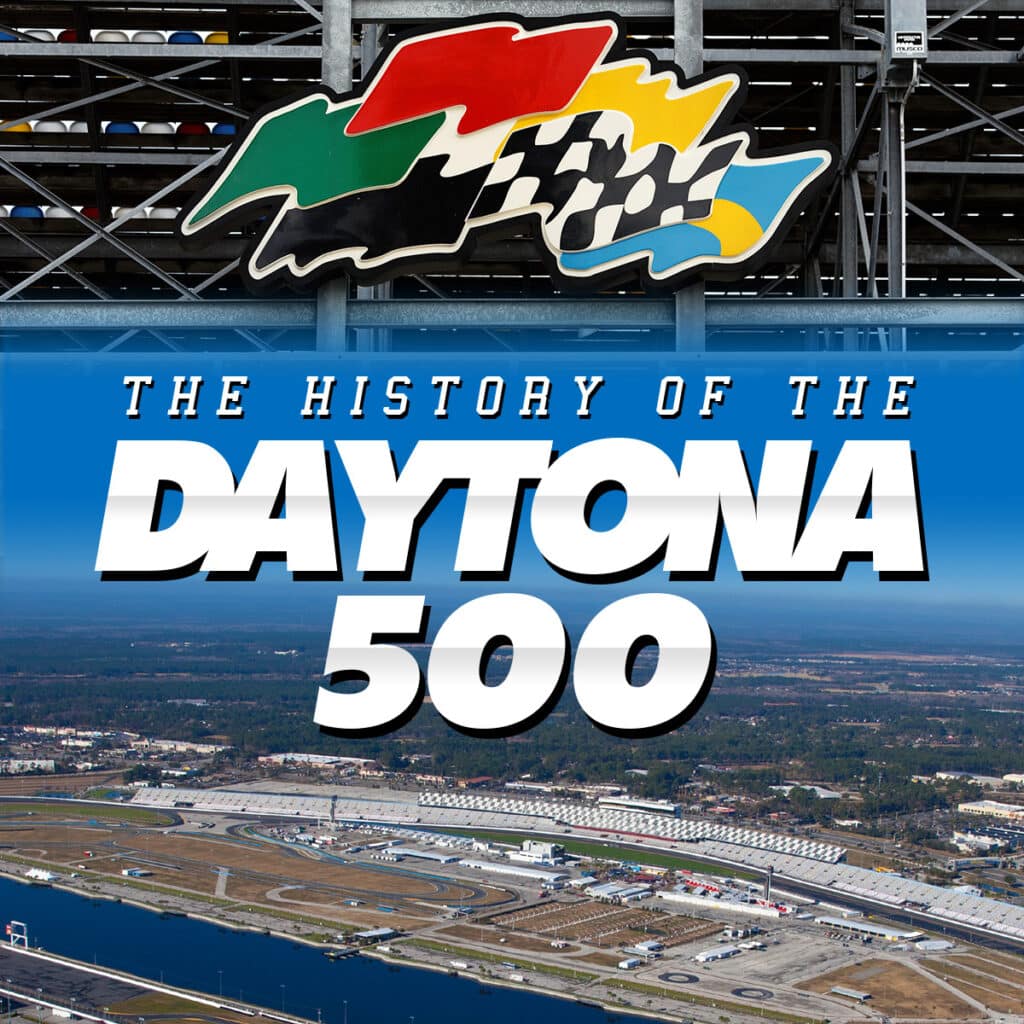
The Daytona 500 is NASCAR’s equivalent of the Super Bowl. Throughout the years it has seen its fair share of dramatic finishes, intense crashes, and underdog winners. An average of 20 million people watch the “Great American Race” every year, according to CNN. Whether you’re new to the sport or have been a fan for years, this infographic provides valuable information about one of America’s most beloved sporting events.

Want More Infographics? Check out the collection on The News Wheel
![]()
The News Wheel is a digital auto magazine providing readers with a fresh perspective on the latest car news. We’re located in the heart of America (Dayton, Ohio) and our goal is to deliver an entertaining and informative perspective on what’s trending in the automotive world. See more articles from The News Wheel.